Mildly advanced frontend: how to build the DesignCourse roadmap?
13 dec 2021
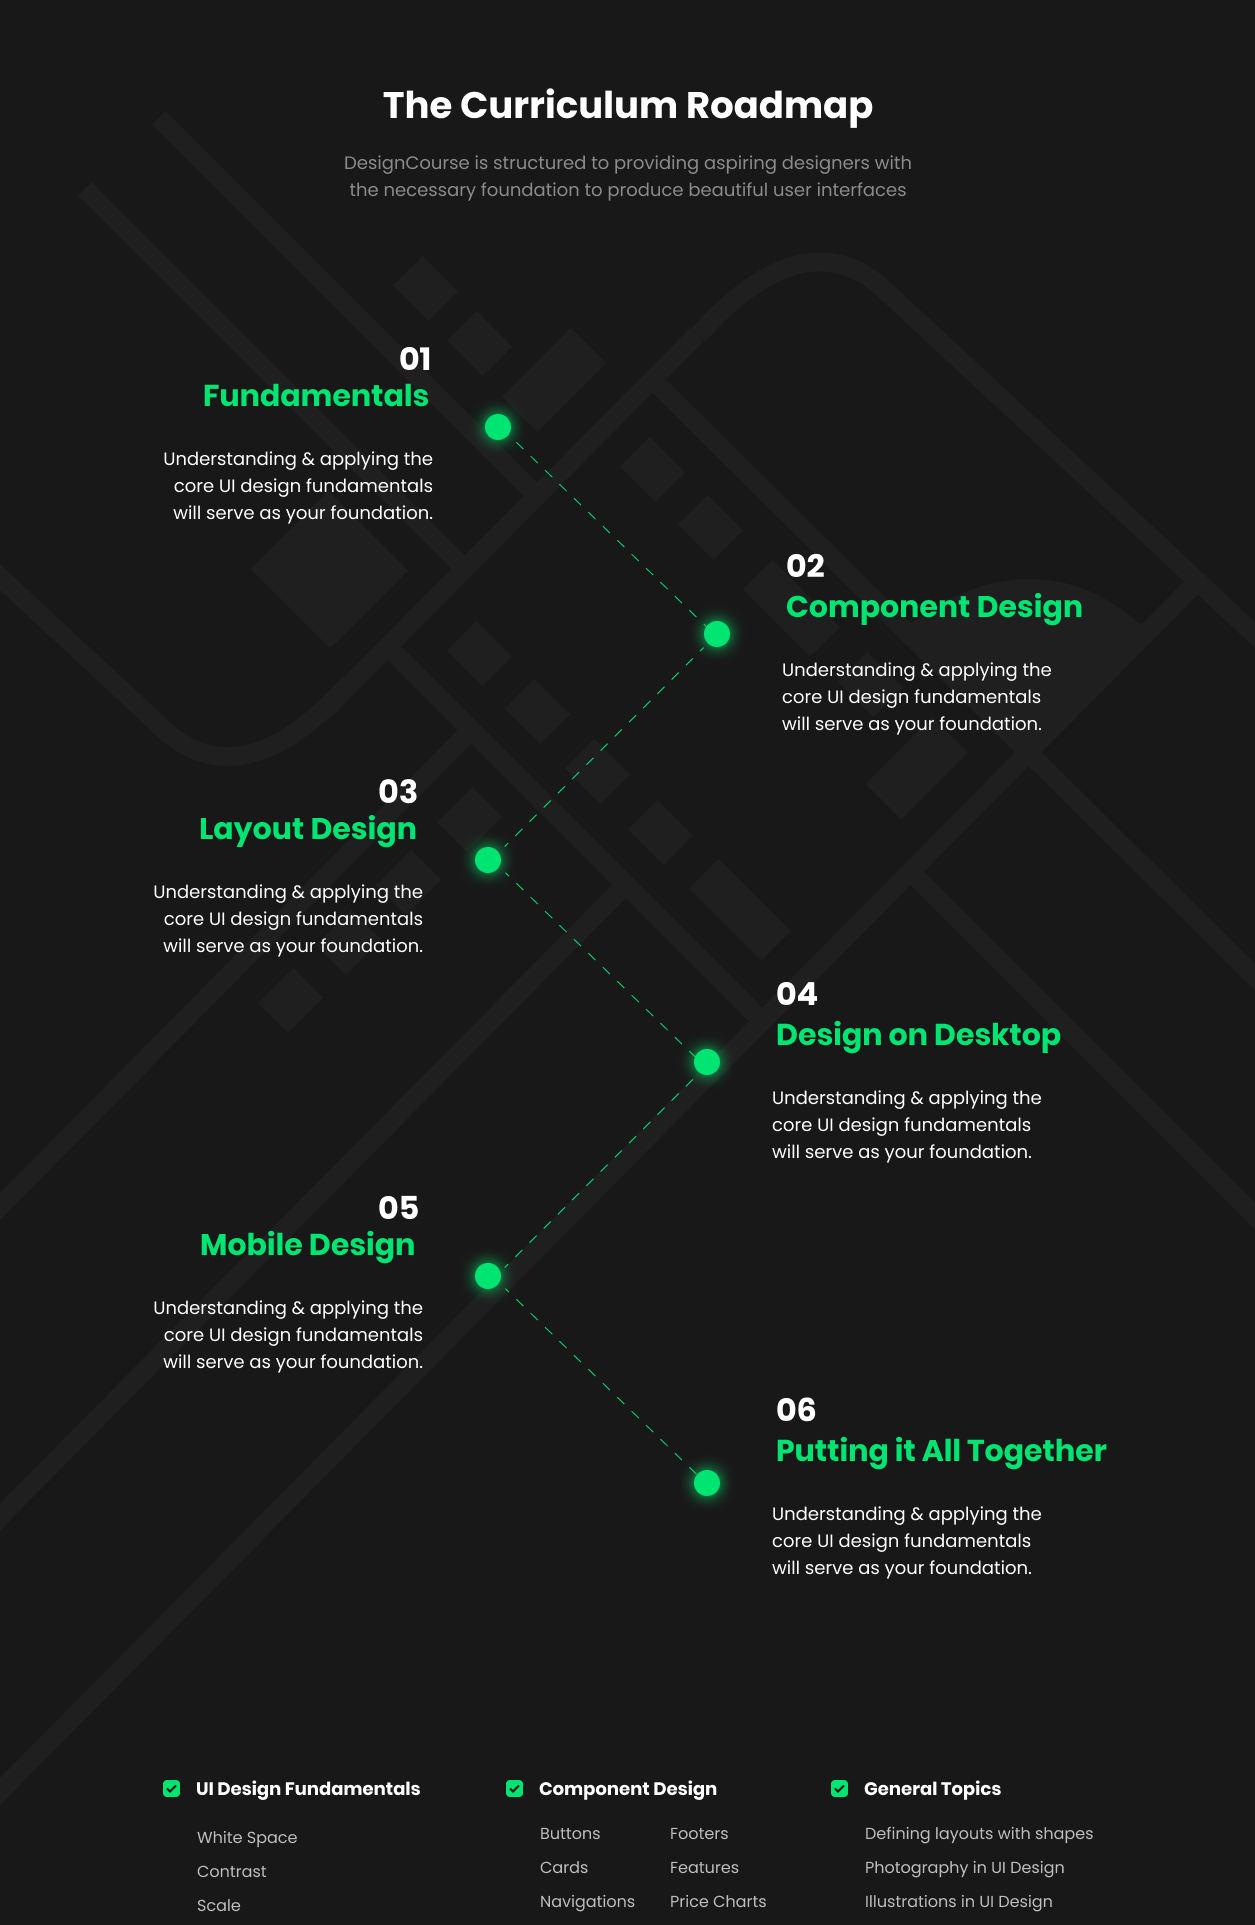
The roadmap section on the website for the DesignCourse | Learn UI / UX Design course is a technological marvel, and since I’ve seen various people ask about it, I’ll explain how to build it! We’ll be using SCSS for this post.
Starting of with the design, there’s a few tough things in there.
The two challenges are as follows:
The background, which is a more complex shape and should extend beyond the container of the roadmap
The dotted lines between each point
To get started, we’ll want to make a basic layout container. Something to put all our content in.
HTML
CSS
<main><divclass="roadmap-container"><h1>This is my base layout. It's nice and centered! The max width is not super big, but it'll suffice.</h1></div></main>
Now that we have a container, we can start adding content, including the dots. We’ll use the :nth-child selector to select every even element (> div:nth-child(even)) to change the text alignment and show the relevant “dot”.
We give each dot some margin, and hide if it’s on the wrong side of the odd/even child. We’ll turn each dot into a circle, then add a shadow to give off the glow.
We will also give the content of each item a max-width, so we can align it left or right at will through its parent.
HTML
CSS
<main><divclass="roadmap-container"><divclass="content"><divclass="item"><divclass="item-wrapper"><divclass="dot left-dot"></div><divclass="item-content">This is my div</div><divclass="dot right-dot"></div></div></div><divclass="item"><divclass="item-wrapper"><divclass="dot left-dot"></div><divclass="item-content">This is my div</div><divclass="dot right-dot"></div></div></div><divclass="item"><divclass="item-wrapper"><divclass="dot left-dot"></div><divclass="item-content">This is my div</div><divclass="dot right-dot"></div></div></div><divclass="item"><divclass="item-wrapper"><divclass="dot left-dot"></div><divclass="item-content">This is my div</div><divclass="dot right-dot"></div></div></div><divclass="item"><divclass="item-wrapper"><divclass="dot left-dot"></div><divclass="item-content">This is my div</div><divclass="dot right-dot"></div></div></div><divclass="item"><divclass="item-wrapper"><divclass="dot left-dot"></div><divclass="item-content">This is my div</div><divclass="dot right-dot"></div></div></div></div></div></main>
Then, it’ll be made so the green dots are left-aligned on mobile. A simple media query overriding the dots’ visibility will cover this.
HTML
CSS
<main><divclass="roadmap-container"><divclass="content"><divclass="item"><divclass="item-wrapper"><divclass="dot left-dot"></div><divclass="item-content">This is my div</div><divclass="dot right-dot"></div></div></div><divclass="item"><divclass="item-wrapper"><divclass="dot left-dot"></div><divclass="item-content">This is my div</div><divclass="dot right-dot"></div></div></div><divclass="item"><divclass="item-wrapper"><divclass="dot left-dot"></div><divclass="item-content">This is my div</div><divclass="dot right-dot"></div></div></div><divclass="item"><divclass="item-wrapper"><divclass="dot left-dot"></div><divclass="item-content">This is my div</div><divclass="dot right-dot"></div></div></div><divclass="item"><divclass="item-wrapper"><divclass="dot left-dot"></div><divclass="item-content">This is my div</div><divclass="dot right-dot"></div></div></div><divclass="item"><divclass="item-wrapper"><divclass="dot left-dot"></div><divclass="item-content">This is my div</div><divclass="dot right-dot"></div></div></div></div></div></main>
Alright, so we have our dots and our content in a nice layout. Now we’ll want to add the background.
The design shown at the very top of this post was made in Figma, and so was the background. It was made using various vectors and lines. Luckily, Figma has a tool to export these to a single SVG.
So we know the aspect ratio of the background. Now, it’s time to actually make it into the background — but still let it go outside of the container. For this, we’ll use a ::before.
To make it so it’s properly positioned, we’ll make the wrapper of the entire (full-width) container one that has a position that is relative. Then, we set the position of the background to absolute, make it full width, and add a padding-bottom of 134% to keep the aspect ratio.
Note:
I changed the media query into a lower max width so it displays nicely on the website.
HTML
CSS
<main><divclass="roadmap-container"><divclass="content"><divclass="item"><divclass="item-wrapper"><divclass="dot left-dot"></div><divclass="item-content">This is my div</div><divclass="dot right-dot"></div></div></div><divclass="item"><divclass="item-wrapper"><divclass="dot left-dot"></div><divclass="item-content">This is my div</div><divclass="dot right-dot"></div></div></div><divclass="item"><divclass="item-wrapper"><divclass="dot left-dot"></div><divclass="item-content">This is my div</div><divclass="dot right-dot"></div></div></div><divclass="item"><divclass="item-wrapper"><divclass="dot left-dot"></div><divclass="item-content">This is my div</div><divclass="dot right-dot"></div></div></div><divclass="item"><divclass="item-wrapper"><divclass="dot left-dot"></div><divclass="item-content">This is my div</div><divclass="dot right-dot"></div></div></div><divclass="item"><divclass="item-wrapper"><divclass="dot left-dot"></div><divclass="item-content">This is my div</div><divclass="dot right-dot"></div></div></div></div></div></main>
And that’s that! It scales and everything!
Now it’s time for the hard part — the dotted green lines. On DesignCourse we decided on using an HTML5 <canvas> element with some JavaScript to draw the lines between dots.
First, we make the <canvas>. The parent being relative is very useful in this scenario, since we want to position the canvas over the entire container. We can do this by making it absolute, set the top and left to 0, and making the width and height 100%;
We also need to set the z-index for the canvas to -1 so it’s behind the content.
In JavaScript, we’ll make a function to calculate and draw the lines. Since we also want it to work when you resize the window, we’ll also run this function when there’s a resize event on the window.
functiondoRoadmapLines(){// Find all visible dots, then draw lines between them}doRoadmapLines();
window.addEventListener('resize', doRoadmapLines);
Now we need an array of visible dots. We’ll use document.querySelectorAll() to find all the dots, and then filter them to only show the ones that are visible. Before we can use the filter method on arrays, though, we need to convert the result from the document.querySelectorAll() into an actual array . For that, we’ll use Array.from(myNodeList) — though you can also use [...myNodeList].
To see if the dots are visible, we’ll use their width and height.
Now that have an array of visible dots, we can loop over them, find their positions, and start drawing.
The process is as follows:
For each dot, see if there’s one that follows it in the array (if there isn’t one, just stop)
Start a line on the canvas. Use beginPath()
Move the start of the line to the current dot. Use moveTo. Don’t forget to add half the dot’s width to the x position, and half the dot’s height to the y position so the line stays centered.
Create a line to the next dot. Use lineTo. Again, don’t forget to add half the dot’s width to the x position, and half the dot’s height to the y position so the line stays centered.
Set the color, line type (dotted), and line width. Use strokeStyle, setLineDash(), and lineWidth.
Stroke the actual path
To find the coordinates for each dot on the canvas, we’ll want to make a function to get the dot’s position relative to the container.
This method takes the dot element and the bounding client rect of the canvas, then returns the dot’s position relative to the canvas.
Now, we’ll loop over the array of visible dots, get the positions, and draw a red dot so we’re sure we have the position.
const canvasBox = canvas.getBoundingClientRect();for(let i =0; i < visibleDots.length; i++){const dot = visibleDots[i];const dotPosition =getOffset(dot, canvasBox);// Draw a red dot
ctx.beginPath();
ctx.arc(
dotPosition.left + dotPosition.width /2,
dotPosition.top + dotPosition.height /2,50,0,2* Math.PI);
ctx.fillStyle ='red';
ctx.fill();}
HTML
CSS
JS
<main><divclass="roadmap-container"><canvas></canvas><divclass="content"><divclass="item"><divclass="item-wrapper"><divclass="dot left-dot"></div><divclass="item-content">This is my div</div><divclass="dot right-dot"></div></div></div><divclass="item"><divclass="item-wrapper"><divclass="dot left-dot"></div><divclass="item-content">This is my div</div><divclass="dot right-dot"></div></div></div><divclass="item"><divclass="item-wrapper"><divclass="dot left-dot"></div><divclass="item-content">This is my div</div><divclass="dot right-dot"></div></div></div><divclass="item"><divclass="item-wrapper"><divclass="dot left-dot"></div><divclass="item-content">This is my div</div><divclass="dot right-dot"></div></div></div><divclass="item"><divclass="item-wrapper"><divclass="dot left-dot"></div><divclass="item-content">This is my div</div><divclass="dot right-dot"></div></div></div><divclass="item"><divclass="item-wrapper"><divclass="dot left-dot"></div><divclass="item-content">This is my div</div><divclass="dot right-dot"></div></div></div></div></div></main>
Look ma, no hands! Now there’s a large red dot behind each green one to show the canvas logic works.
Now comes the easy part: making the lines. For each dot we see if there’s one after it, and if there is, we’ll draw a line between them.
We’ll use the context’s setLineDash method to make the lines dashed, like so:
ctx.setLineDash([15,15]);
You can change the number to change the length of the lines and the space between them.
To make this as dynamic as possible, we’ll set the color of the line to the same color as the dots
We’ll make one dot red to showcase how it takes the color of the dot to draw the line to the next dot.
HTML
CSS
JS
<main><divclass="roadmap-container"><canvas></canvas><divclass="content"><divclass="item"><divclass="item-wrapper"><divclass="dot left-dot"></div><divclass="item-content">This is my div</div><divclass="dot right-dot"></div></div></div><divclass="item"><divclass="item-wrapper"><divclass="dot left-dot"></div><divclass="item-content">This is my div</div><divclass="dot right-dot"></div></div></div><divclass="item"><divclass="item-wrapper"><divclass="dot left-dot"></div><divclass="item-content">This is my div</div><divclass="dot right-dot"></div></div></div><divclass="item"><divclass="item-wrapper"><divclass="dot left-dot"></div><divclass="item-content">This is my div</div><divclass="dot right-dot"></div></div></div><divclass="item"><divclass="item-wrapper"><divclass="dot left-dot"></div><divclass="item-content">This is my div</div><divclass="dot right-dot"></div></div></div><divclass="item"><divclass="item-wrapper"><divclass="dot left-dot"></div><divclass="item-content">This is my div</div><divclass="dot right-dot"></div></div></div></div></div></main>
There you go! It works on mobile mobile and desktop, and changes on resize.
Just to show it can draw the line anywhere within the canvas’ reach, I’ve made a demo where you can move a dot around.
For this demo I moved the canvas outside of the main component and set the body's min height to 500vh, so the canvas is always taller than the content. You don't usually want to do this.
And there you have it! The roadmap section with the background and the dotted lines. The code in this article was written fairly quickly, so it should not just be copied and pasted. Instead, use the lessons you learned to write it yourself!


